Black To Green

For the past few months I've been thinking a lot about what to do (programming/engineering wise) with this blog. I've always experimented with new things here, and it's always been my go-to project for learning a new tech stack (when appropriate of course, so mostly web stuff).
This place has been through, what, three rewrites now? (1) (1) Technically four if you count migrating from Sapper to SvelteKit, but I wouldn't. From static html served on Apache, to a Python web server with templating, to its' latest iteration - a static site generated with Svelte.
And this has got me thinking - this site has been growing in size every time I rewrite it, but all the functionality has pretty much been the same.
When I was uploading hand made HTML files to an Apache server, the average size was 20 KB. Now the average size of a page on this blog is probably around 1 MB depending on how many images there are - a 50x increase. And yet this iteration is no more readable than the last, or the last any more readable than the one before that. The only new functionality is the footnotes which could have easily been added in the previous iterations while keeping their small page size.
However, to be fair to me, I feel like I've actually done a good job of trying to minimise the extraneous garbage bloating the modern web - JavaScript. As I'm writing this, apart from one, no page on this blog requires JS and is completely functional without it. Things like the footnotes (which are responsive to screen size changes (2) (2) Getting this working was kinda interesting so I'm going to talk about it here. Essentially, since my Markdown to HTML compiler can only output text inside the actual "content", and I wanted the footnotes to be outside the actual page margin for desktop viewers (so it could be vertically aligned with the text) - I have some JS to parse the HTML, look for footnotes, duplicate them, place them outside the main content, and align them to the text that they're "footnoting". Then I can have some CSS classes to hide and show the two footnotes depending on the screen size. ) required a little bit of effort to get built server side, but have allowed me to provide you with an (almost) completely JS free reading experience.
That basically just leaves me with two reasons for why this blog has increased in size by so much:
- The custom font.
- Uncompressed images.
The font is non-negotiable, I'm not getting rid of the font. I know you 100 KB evangelists hate custom fonts and believe every website should just use the boring stock fonts that your browser comes with, and to be honest, I would normally agree with you. However, consider this counter-argument if you will:
I PAID ALMOST AUD$600 FOR THIS THING. I'M GOING TO FUCKING USE IT. I'M NOT GETTING RID OF IT. FUCK OFF.
So that just leaves us with the images.
The obvious answer to this problem is to not use images.
No. I don't pay for the images, so I'm not particularly angry that you would even suggest that, but I do think the images are pretty important for my posts. I'm also talking about those header images that are completely unnecessary in most cases - I like them, and I think they add character to this barren and decrepit void of a website.
The next obvious answer is to compress the images, as I haven't been doing that because I'm very lazy.
I'm okay with this, in fact, I think I can do you one better :)
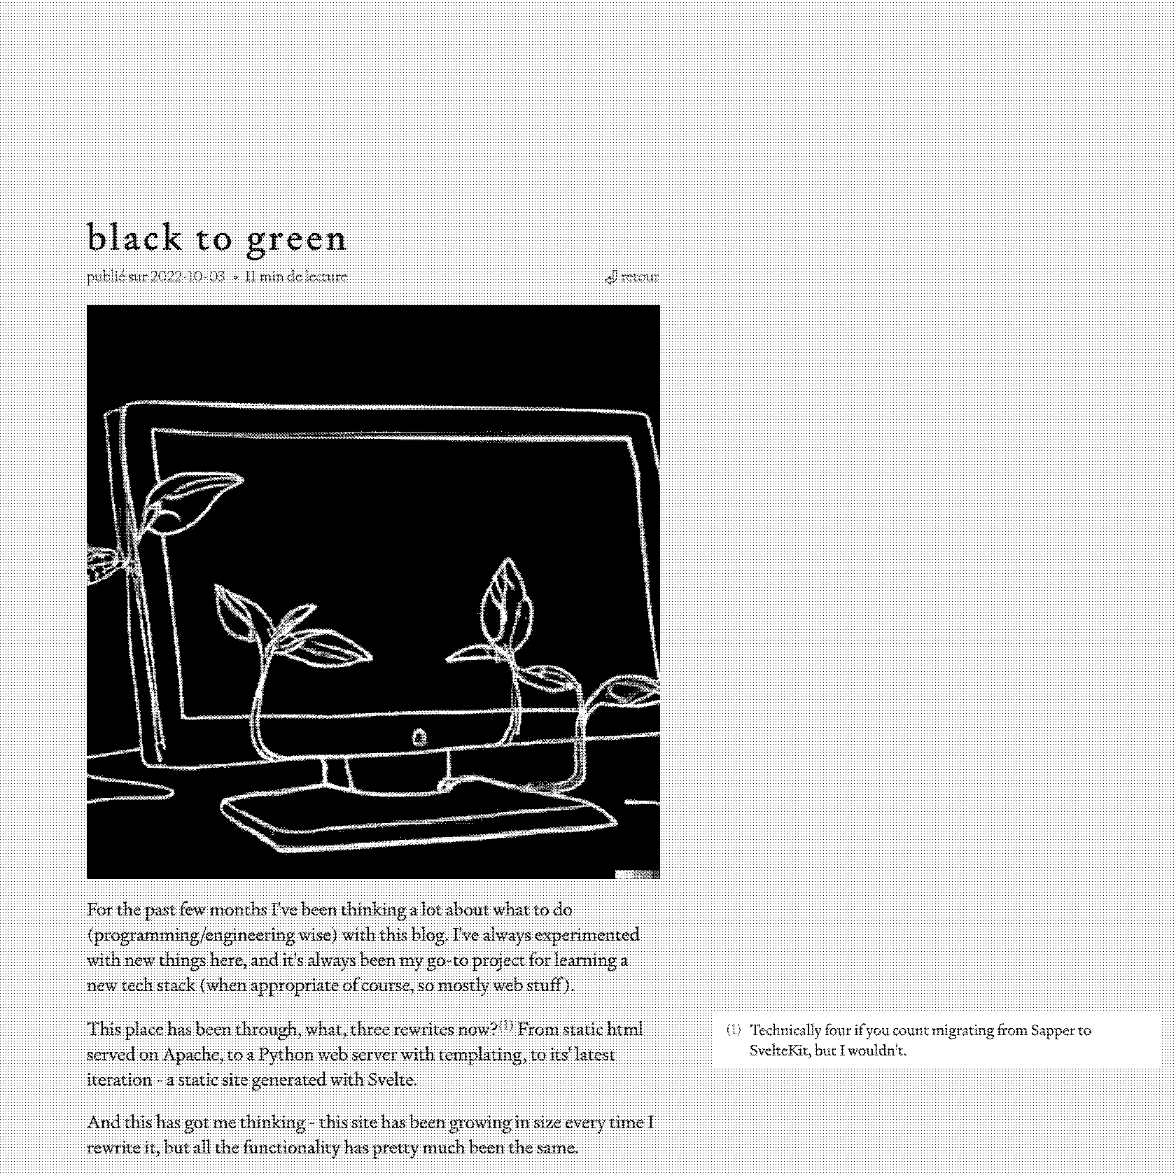
All the images on this blog are now, compressed, re-sized, greyscaled, and "dithered". Everything except that last one shouldn't really need an explanation, so let's talk about dithering.
Dithering is a retro way of reducing the colours in an image for use on old hardware or in print. It removes colours, and strategically place dots to emulate the missing shades.
This blog post by Surma is a really good introduction to it. Here's the Julia code I used to dither my normal images.
using DitherPunk
using FileIO
using Images

percentage_scale = 0.7

function dither_recursive(dir::String)
    for i in readdir(dir)
        path = string(dir, "/", i)

        if isdir(path)
            dither_recursive(path)
        else
            new_path = string(dir, "/../dither/", i)

            if isfile(new_path)
                continue
            end

            img_gray = convert.(Gray, load(path))
            new_size = trunc.(Int, size(img_gray) .* percentage_scale)
            new_img =  imresize(dither(img_gray, Bayer()), new_size)
            save(new_path, new_img)

            @info "dithered image" new_path
        end
    end
end

function main(args::Vector{String})
    for dir in args
        dither_recursive(dir)
    end
end

main(ARGS)
I've also been think about ways to make this site more "eco-friendly". Keeping the size of the site as low as possible is the best way to do this, but I think there are more interesting things I could attempt.
It would cool to run this place on a solar-powered server I run in my apartment, since this place doesn't particularly need a 99% uptime, but I'm a little cautious of having my home Internet "opened" up to everyone, even if it's limited to port 443.
If I can find a way to do this while still feeling secure, it's definitely going to be done. But for now, I'll need to think of something else.
Something I've really liked the style of is how the online magazine "Branch" is designed to be "Demand Responsive" and to adapt to and reflect the physical infrastructure of the Internet and the energy behind it.
Utilising data from a grid intensity API and the user’s location, Branch has different interface designs that are shown dependent on the current energy demand and fossil fuels on the grid where the user is.
I enjoy the idea of doing something like this, but one thing I don't like about how Branch has done it is their use of a "grid intensity API and the user’s location".
This makes JS practically a requirement to work, which as we all know by now, just bloats the website and should be unnecessary.
Australia is somewhat infamous for being behind on renewables, so I'm always on the "high grid intensity view" which should be providing me with the lowest amount of data necessary to make the site work.
When grid demand is high and less renewables are being used we reverse the way media content is shown by emphasising the alt text instead. The user can click to reveal the content if they wish, but it is not automatically loaded for them, this also creates the need to craft alt texts to make them much more descriptive than they may usually be.
However, the size of that page is 2.26 MB. Using WordPress also certainly isn't helping.
So I wanted to copy them, but do it my way. And that's by shoving as much of the functionality to the server side and have all the work done during the build process instead of client side.
This is actually a lot harder than it sounds - how am I supposed to change the content of this blog when it's a static site?
I would need something server side that could edit the content of the static page as it's being requested. This could be done with an ExpressJS server or something else like that, but those are too bloated for me - I run this site on a cheap VPS hosted in Finland (3) (3) To make up for the fact this isn't solar powered yet. Finland has a pretty good renewable energy policy. and would prefer to avoid wasting any resources that don't need to be used.
Instead, I looked for a pure nginx solution. Something like njs, which is a subset of JavaScript that can be used in nginx modules. It uses its own engine that converts njs code into bytecode, since V8 and friends are not fast enough.
I also want to avoid having to call an API on every request to get grid intensity data, because this would make the requests too slow and unresponsive. So I wanted download all the data at the start of the build process and just read from a file instead. Unfortunately, I haven't found a service that lets me download everything, as most can only do specific countries, so I've just made a list of the countries that have good carbon intensity.
Basically, I just went on to Electricity Maps, clicked on all the countries that were green, and put them in the following list:
- France
- New Zealand
- Finland
- Sweden
- Norway
- Iceland
- Austria
- Brazil
- Guatemala
- Costa Rica
I've made it so that anyone coming from an IP address that is assigned to one of these countries will see the "low grid intensity view". I'll be checking, the map every now and again to see if the list needs updating, as it would be kinda cool to see it grow (hopefully).
But there's still some problems with this approach - how do I know what country an IP comes from if I refuse to use any third party APIs?
Well… I just cache every IP address in a file (or at least the subnet ranges), and read that obviously. There's a nice website, iptoasn.com that let's us do this. It's not every IP range, but it's probably enough. (4) (4) I think this only gets residential IPs since the IPs my VPN provides aren't on the list, but my home Internet is. If you live in one of these countries, let me know if it actually works ;)
Here's the script to download it:
#!/bin/bash
set -euo pipefail
IFS=$'\n\t'

cd "$(dirname "$0")"

ip2dec() {
    local a b c d
    IFS=. read -r a b c d <<< "$1"
    echo -n "$((a * 256 ** 3 + b * 256 ** 2 + c * 256 + d))"
}

curl --compressed https://iptoasn.com/data/ip2country-v4.tsv.gz -o ip2country-v4.tsv.gz
gunzip ip2country-v4.tsv.gz

countries=(
    "FR" # France
    "NZ" # New Zealand
    "FI" # Finland
    "SE" # Sweden
    "NO" # Norway
    "IS" # Iceland
    "AT" # Austria
    "BR" # Brazil
    "GU" # Guatemala
    "CR" # Costa Rica
)

for c in ${countries[@]}; do
    grep $c ip2country-v4.tsv >> ip.tsv
done

tr '\t' ',' < ip.tsv > ip.csv

(while IFS=, read -r a b c; do ip2dec $a; echo -n ,; ip2dec $b; echo -n ,; echo $c; done < ip.csv) > ip-dec.csv

rm -f ip.tsv ip2country-v4.tsv
This converts the IP addresses into decimal integers so that it's easier to figure out if a user's IP is in the range.
The next problem, was probably the most annoying thing I've ever had to deal with and required the most stupid hack to fix.
Okay, so, in my njs script I have some logic to change the HTML of the request to add in the CSS overrides for the "low grid intensity view". The issue is that this would change the length of the request, but wouldn't change the Content-Length header, so things would get cut off.
Shouldn't be a big deal right? Just get the length of the CSS I'm injecting and add it to the Content-Length.
DOESN'T WORK. NGINX WAS STILL USING THE OLD Content-Length.
I could change the values of EVERY OTHER HEADER except the ONE thing making the entire site break.
This means I had to make the "high grid intensity view" the exact same size at the low view, but with a few things changed. Which is now why this line of code is in the base HTML file:
.AAAAAAAAAAAAAAAAAAAAAAAAAAAAAAAAAAAAAAAAAAAAAAAAAAAAAAAAAAAAAAAAAAAAAAAAAAAAAAAAAAAAAAAAAAAAAAAAAAAAAAAAAAAAAAAAAAAAAAAAAAAAAAAAAAAAAAAAAAAAAAAAAAAAAAAAAAAAAAAAAAAAAAAAAAAAAAAAAAAAAAAAAAAAAAAAAAAAAAAAAAAAAAAAAAAAAAAAAAAAAAAAAAAAAAAAAAAAAAAAAAAAAAAAAAAAAAAAAAAAAAAAAAAAAAAAAAAAAAAAAAAAAAAAAAAAAAAAAAAAAAAAA{}
This has to be the exact same size as the CSS I'm replacing it with, any less and things get cut off, any more and the browser won't finish the request since it doesn't think it's done.
Update 2023-01-17: This got fixed in a later nginx version, I don't have to do this anymore.
Anyway, here is the njs module for reference if you were curious:
const fs = require('fs');

const GREEN_CSS = "[removed for space reasons]";

const ip2int = (ip: string) =>
  ip.split('.').reduce((ipInt, octet) => (ipInt<<8) + parseInt(octet, 10), 0) >>> 0;

const geoIp = (r: NginxHTTPRequest, data: string, flags: NginxHTTPSendBufferOptions): void => {
  if (!r.uri.endsWith(".html") || r.uri.includes("/spe_")) {
    r.sendBuffer(data, flags);
    r.done();
    return;
  }

  const ip = r.headersIn['X-Real-IP'] ? r.headersIn['X-Real-IP'] : r.remoteAddress;
  const dec = ip2int(ip).toString();

  const lines = fs.readFileSync('/opt/db/ip-dec.csv').toString().split('\n');
  const green = lines.some((l: string) => {
    const [start, end] = l.split(',');
    return ((dec >= start) && (dec <= end));
  });

  const cookies = r.headersIn["Cookie"]?.split(";") || [];

  if (
    !cookies.some(x => x.trim() === "debug-black=yeppers") &&
    (green || cookies.some(x => x.trim() === "debug-green=yeppers"))
  ) {
    data = data.replace(/.AAAAAAAAAAAAAAAAAAAAAAAAAAAAAAAAAAA.*/, GREEN_CSS);
    data = data.replace(/\/img\/dither/g, "/img/normal");
  }

  r.sendBuffer(data, flags);
  r.done();
};

export default { geoIp };
Since the green version of this site is currently only available in 10 countries, and you might want to see it for yourself, I added a debug cookie option to do that. Just create a cookie with the key-value of debug-green=yeppers and do a hard reload of the page (to refresh the cache).
If you don't want to do that, or are viewing this from an archiving service that can't run the njs module, here's a small screenshot to help satiate your curiosity :)